Back
24 Jan 2020
EUR/USD Price Analysis: Euro rolls into Asia below the 1.1063 resistance
- EUR/USD remains under selling pressure below the 1.1063 resistance.
- The level to beat for bears is the 1.1035 support.
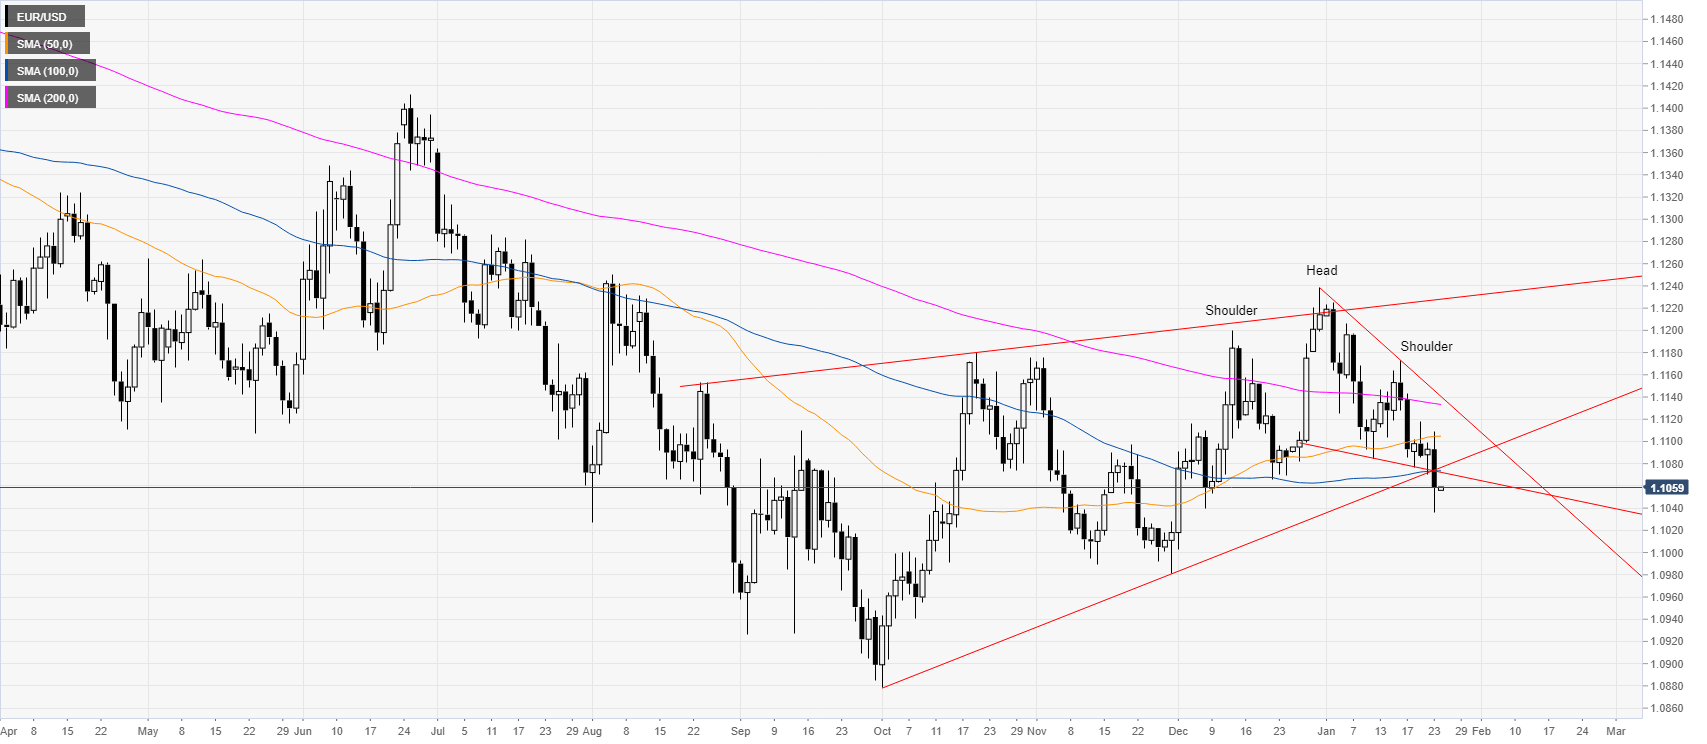
EUR/USD daily chart
EUR/USD is trading in a weak bear trend below its main simple moving averages (SMAs). Additionally, the spot is also breaking to the downside from a bull channel which started in October 2019. The bull flag from December 2019 failed as bears took over. EUR/USD formed a head-and-shoulders pattern which is weighing on EUR/USD.
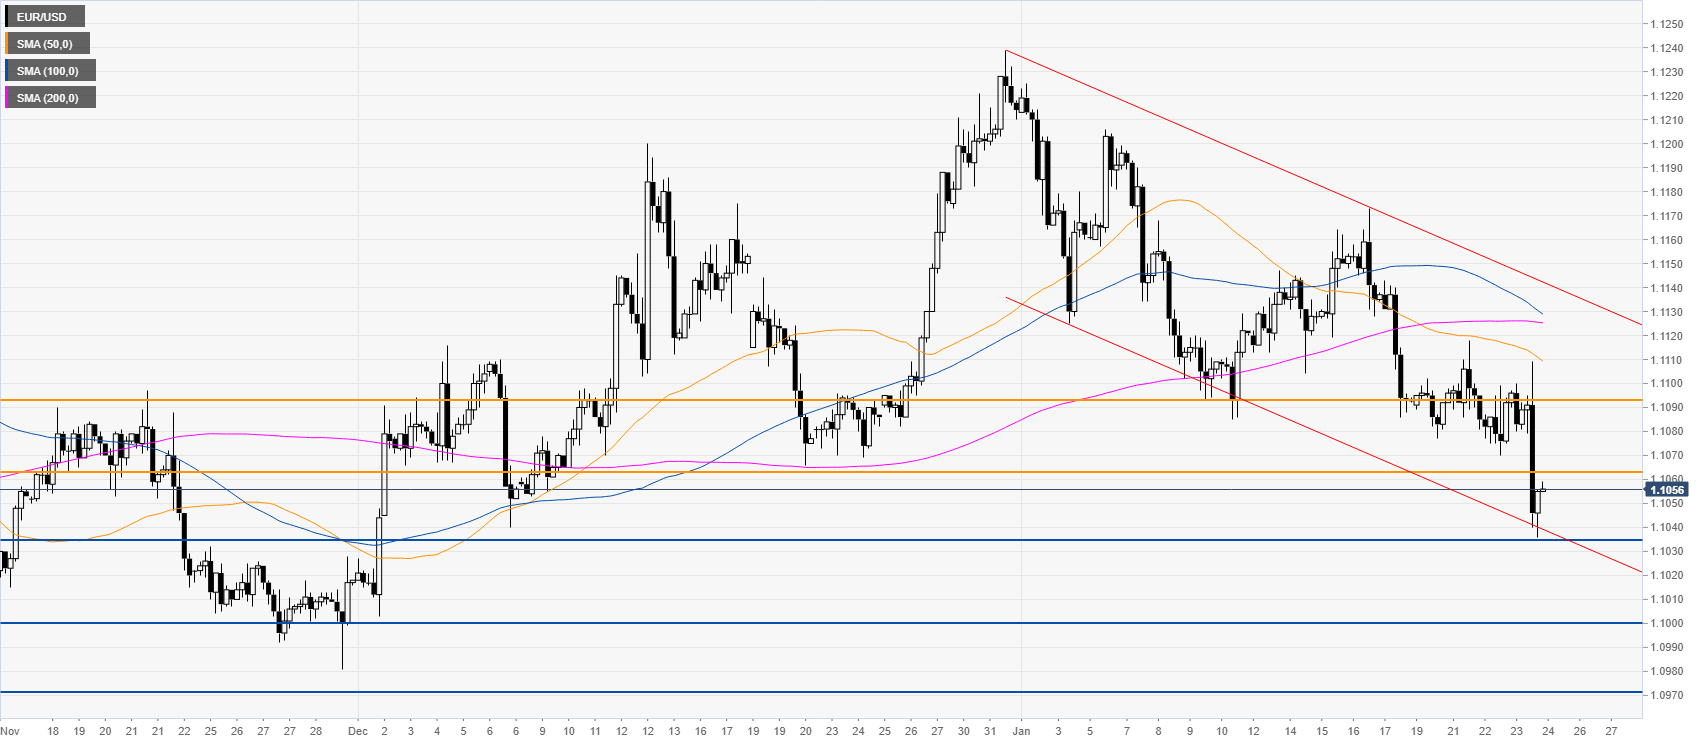
EUR/USD four-hour chart
The spot is trading in a down channel below its main SMAs. The spot is rebounding from the 1.1035 support; however, if the bears break below this level, the euro, in the next sessions, can continue to decline towards the 1.1000 and 1.0971 levels, according to the Technical Confluences Indicator.
Additional key levels