USD/INR Price Analysis: Justifies Friday’s bearish doji with eyes on 61.8% Fibonacci
- USD/INR declines from six-week high after Friday’s bearish candlestick formation.
- 61.8% Fibonacci retracement, short-term rising support line in focus.
- A falling trend line from September 2019 grabs the buyers’ attention.
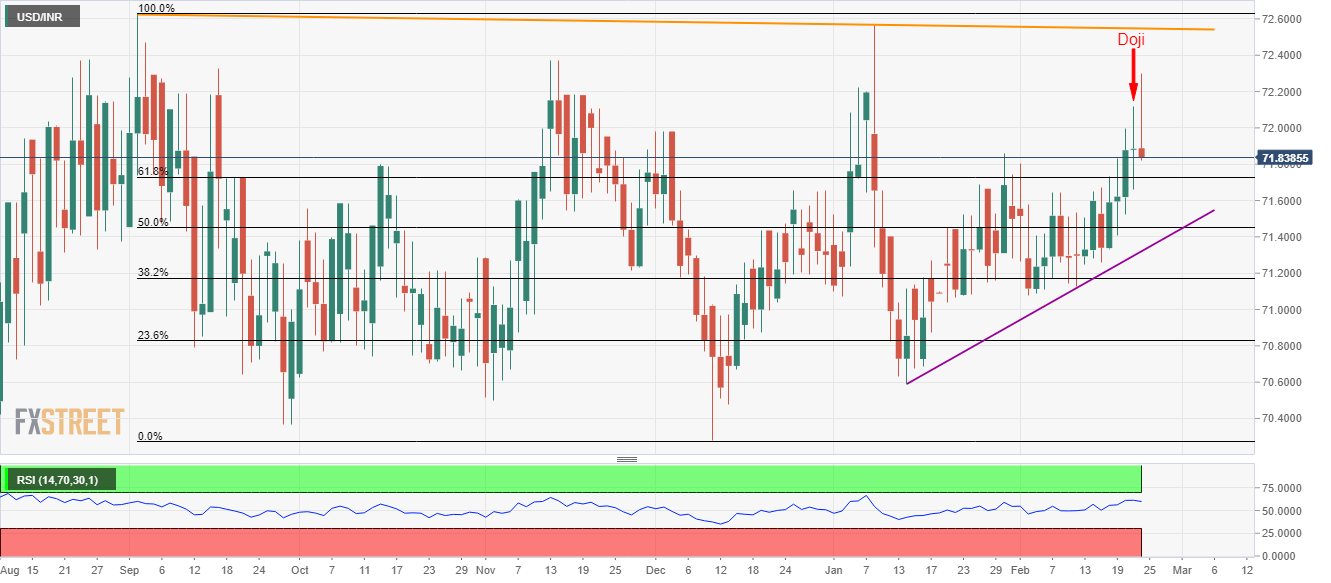
USD/INR declines to 71.85 amid the initial Indian session on Monday. The pair recently took a U-turn from the highest levels since January 08 after flashing Doji candlestick on Friday.
With this, sellers are now targeting 61.8% and 50% Fibonacci retracements of September-December 2019 declines, respectively around 71.73 and 71.45, during further downside.
However, an upward sloping trend line from January 14, at 71.32 now, can question the pair’s additional south-run past-71.45.
On the upside, a descending resistance line stretched from September 03, 2019, close to 72.55, offers the immediate resistance to the pair ahead of the September 2019 top near 72.63.
Given the pair’s sustained run-up past-72.63, the bulls can take aim at December 2018 high surrounding 72.90.
USD/INR daily chart
Trend: Pullback expected